Safety teams needed one defensible workflow that could estimate crash occurrence and severity together, quantify geometric and control-device effects, rank thousands of sites, and communicate model results without requiring analysts to operate the underlying code.
Completed projectFebruary 2023AI-enabled safety engineering · Decision systems
U.S. DOT grade-crossing safety support system
Led the technical integration of crash-risk modeling, countermeasure analysis, GIS prioritization, and an interactive R Shiny application into one agency-facing safety workflow.
My roleTechnical Project Lead · Lead Developer · Key Investigator
>$200Kfunded initiatives
01 / PROBLEM & CONTEXT
A U.S. DOT-supported program, reinforced by academic and research initiatives, needed to turn separate statistical, spatial, and countermeasure analyses into one usable agency workflow.
- AI/ML
- R Shiny
- GIS
- Decision support
02 / ENGINEERING PIPELINE
How the system moved from raw evidence to a usable decision.
Integrated Cox competing-risk models, countermeasure-effect estimation, GIS hazard mapping, and interactive scenario simulation across approximately 3,900 North Dakota grade crossings.
Evidence
Data
Inventory, crash-history, traffic, train-operation, control-device, geometric, and spatial information covering approximately 3,900 North Dakota grade crossings.
Pipeline
Data engineering
Integrated crossing records and GIS layers, harmonized analysis inputs, generated model-ready variables, and connected scenario inputs to survival-model and mapping outputs inside an R Shiny workflow.
Signals
Data mining
Analyzed temporal crash behavior, severity-specific contributors, geometric relationships, countermeasure patterns, and spatial concentrations across the statewide network.
Model
ML / analytical method
Cox competing-risk models estimated occurrence and severity; marginal-effect analysis evaluated countermeasures; GIS supported network screening; R Shiny operationalized the analytical layers.
Decision
System function
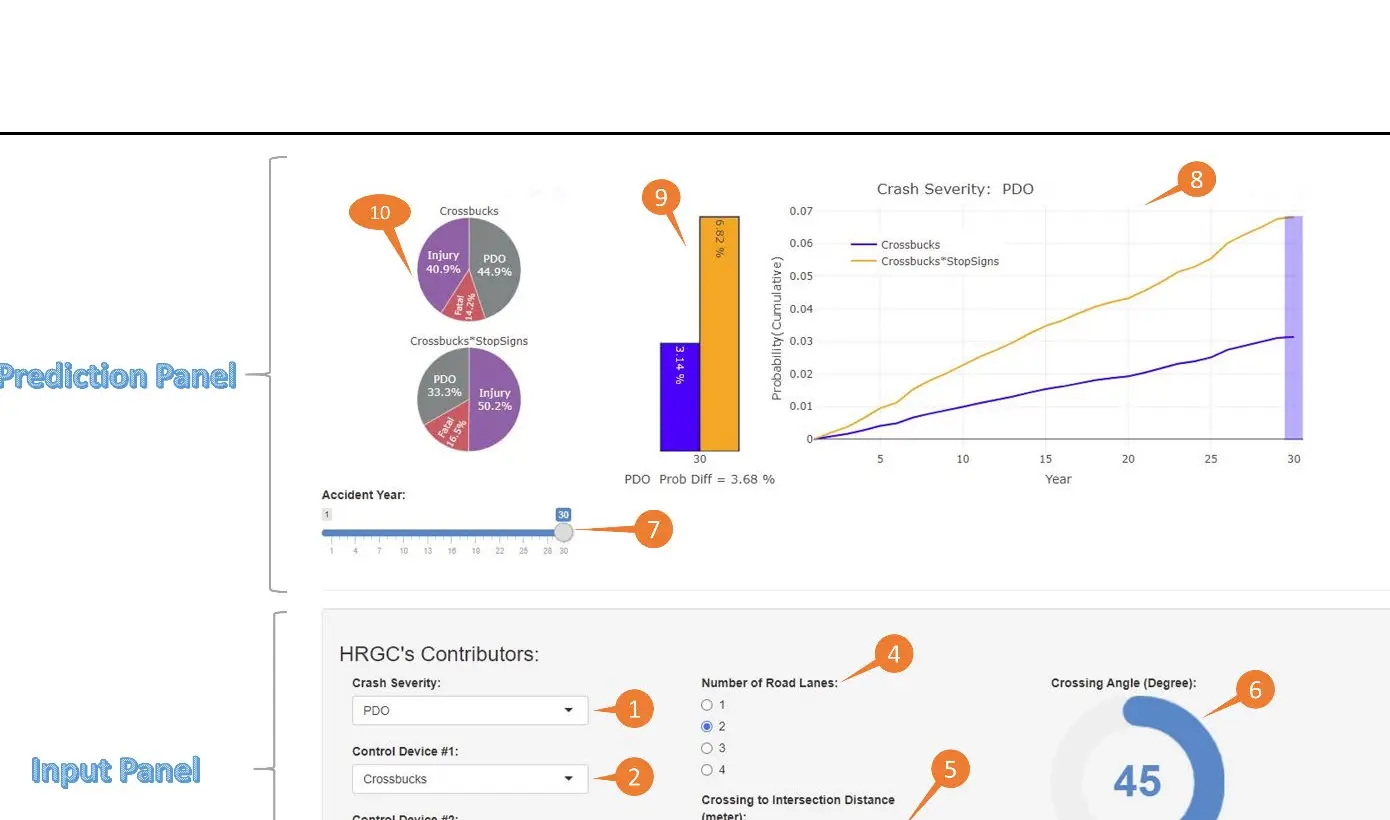
Analysts can configure a crossing, estimate severity-specific risk over time, compare infrastructure scenarios, inspect contributing factors, and view priority locations on maps.
Proof
Validation
The integrated workflow preserved the underlying model outputs and scenario logic so each dashboard result remained traceable to an analytical calculation rather than an opaque score.
Plain-language glossary
Technical terms, made clear.
A framework that turns R analysis into an interactive browser application for analysts and engineers.
Recomputing risk after a proposed change so alternatives can be compared before implementation.
03 / KEY INNOVATIONS
What changed in the engineering approach.
One pipeline connects raw crossing attributes to prediction, prioritization, mapping, and scenario analysis.
The R Shiny layer exposes complex time-to-event models through engineering-friendly controls and plots.
Spatial risk surfaces support network-level screening while preserving location-specific model detail.
04 / TECHNICAL ARTIFACT
05 / MEASURABLE OUTCOMES
What the system established.
Unified crash occurrence, severity, contributing-factor, and countermeasure analysis in one system.
Translated model outputs into risk matrices, maps, and configurable crossing scenarios.
Delivered an interactive tool for comparing infrastructure configurations and severity-specific risk over time.
06 / AGENCY & INDUSTRY IMPACT
Designed to support a decision.
Converted funded U.S. DOT, academic, and research initiatives totaling more than $200K into agency-facing evidence for screening locations and comparing safety investments.
The integrated workflow preserved the underlying model outputs and scenario logic so each dashboard result remained traceable to an analytical calculation rather than an opaque score.
Supports DOT analysts in screening locations, testing infrastructure alternatives, and prioritizing safety-improvement investments with traceable quantitative evidence.