The federal inventory stored crossing angle and distance to the nearest intersection as coarse or truncated categories. Those fields were not precise enough to reveal nonlinear safety relationships or support site-specific engineering decisions.
Completed projectJanuary 2020Geospatial data science · Safety engineering
Geometric effects on highway–rail grade-crossing safety
Engineered continuous geometric features from aligned GIS layers, then modeled how intersection distance, crossing angle, road lanes, and main tracks change long-term crash occurrence and severity.
My roleLead Model Developer · Geospatial Data Engineer · First Author
20.9%30-year crash probability with 3 tracks
01 / PROBLEM & CONTEXT
Highway–rail crossings differ in roadway layout, rail geometry, traffic exposure, and crash history. Engineers needed to know which geometric conditions signal added risk—not simply whether a crossing had crashed before.
- GIS feature engineering
- Competing risks
- Cumulative incidence
02 / ENGINEERING PIPELINE
How the system moved from raw evidence to a usable decision.
The technical story begins with imperfect federal and state location data, replaces coarse geometry fields with measured GIS features, carries the full no-crash population through a competing-risk survival model, and finishes with severity-specific probability curves an engineer can interpret directly.
Evidence
Data
North Dakota GIS Hub roadway, railroad, intersection, and crossing layers were joined with Federal Railroad Administration crash and crossing-inventory records. The longitudinal database contained 3,310 records from 1990–2018; 3,194 public crossings entered the geometric analysis.
Pipeline
Data engineering
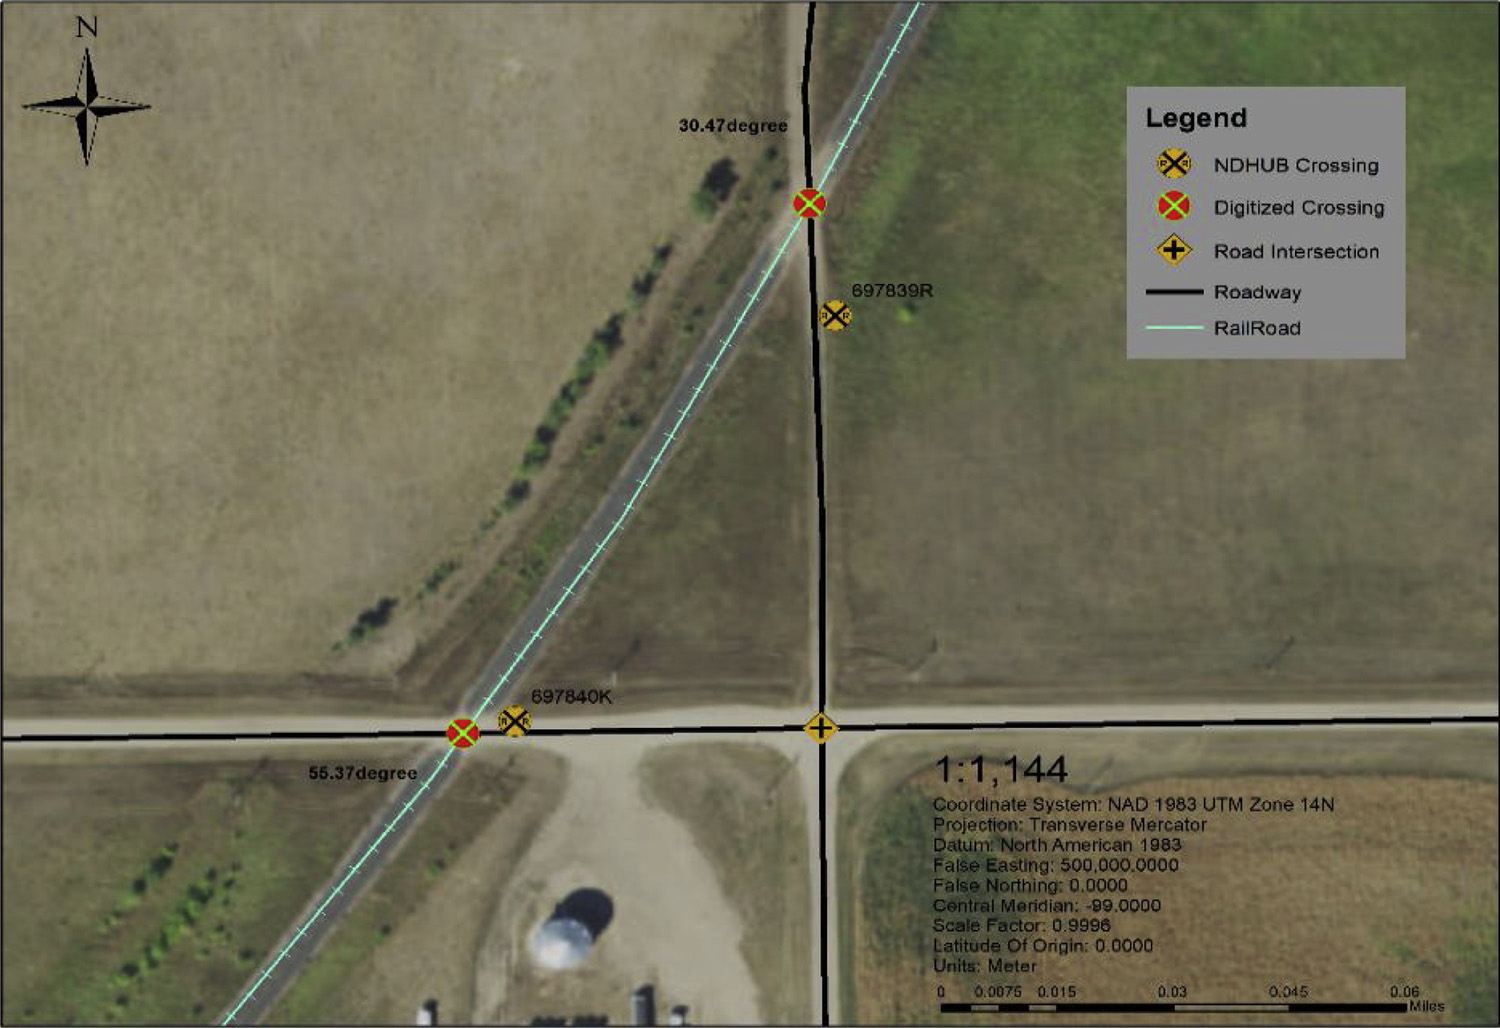
Spatial layers were aligned to street imagery, mismatched crossing locations were redigitized, and road/rail centerlines were intersected inside a one-meter buffer. Coordinate geometry then produced continuous acute angles and nearest-intersection distances instead of relying on coarse inventory categories.
Signals
Data mining
Exploratory and marginal-effect analysis traced nonlinear 30-year risk curves across distance and angle, then separated the effects of road-lane count and main-track count for property-damage, injury, fatal, and overall crash outcomes.
Model
ML / analytical method
Cause-specific Cox survival models estimated the hazard of mutually exclusive crash severities, while cumulative incidence functions converted those hazards into long-term probabilities and accounted for the fact that one first crash outcome prevents the others from occurring first.
Decision
System function
The workflow converts mapped crossing geometry into severity-specific risk evidence, allowing an engineer to screen locations and identify where complex geometry warrants added countermeasures or field review.
Proof
Validation
All four geometric factors were tested inside a multivariable survival framework with traffic, train-operation, surface, and detection controls. Statistical significance and 30-year probability curves were reviewed by outcome rather than collapsed into one score.
Plain-language glossary
Technical terms, made clear.
A time-to-event method for outcomes that cannot all happen first; here, the first recorded crash is property-damage, injury, or fatal.
Keeping crossings with no observed crash in the analysis for the time they were safely observed, instead of treating them as missing.
The probability that a specific crash outcome occurs by a future time while accounting for the other possible first outcomes.
03 / KEY INNOVATIONS
What changed in the engineering approach.
Continuous GIS-derived angle and distance measurements replace truncated federal categories and preserve local geometric detail.
Redigitization and one-meter buffer intersections resolve spatial misalignment before any statistical modeling begins.
One competing-risk framework models crash occurrence and severity together instead of fitting incompatible models to different samples.
Censoring keeps crossings with no observed crash in the learning population rather than discarding most of the network.
Cumulative incidence curves reveal nonlinear, time-dependent effects that a coefficient table or single risk score cannot show.
04 / TECHNICAL ARTIFACT
05 / MEASURABLE OUTCOMES
What the system established.
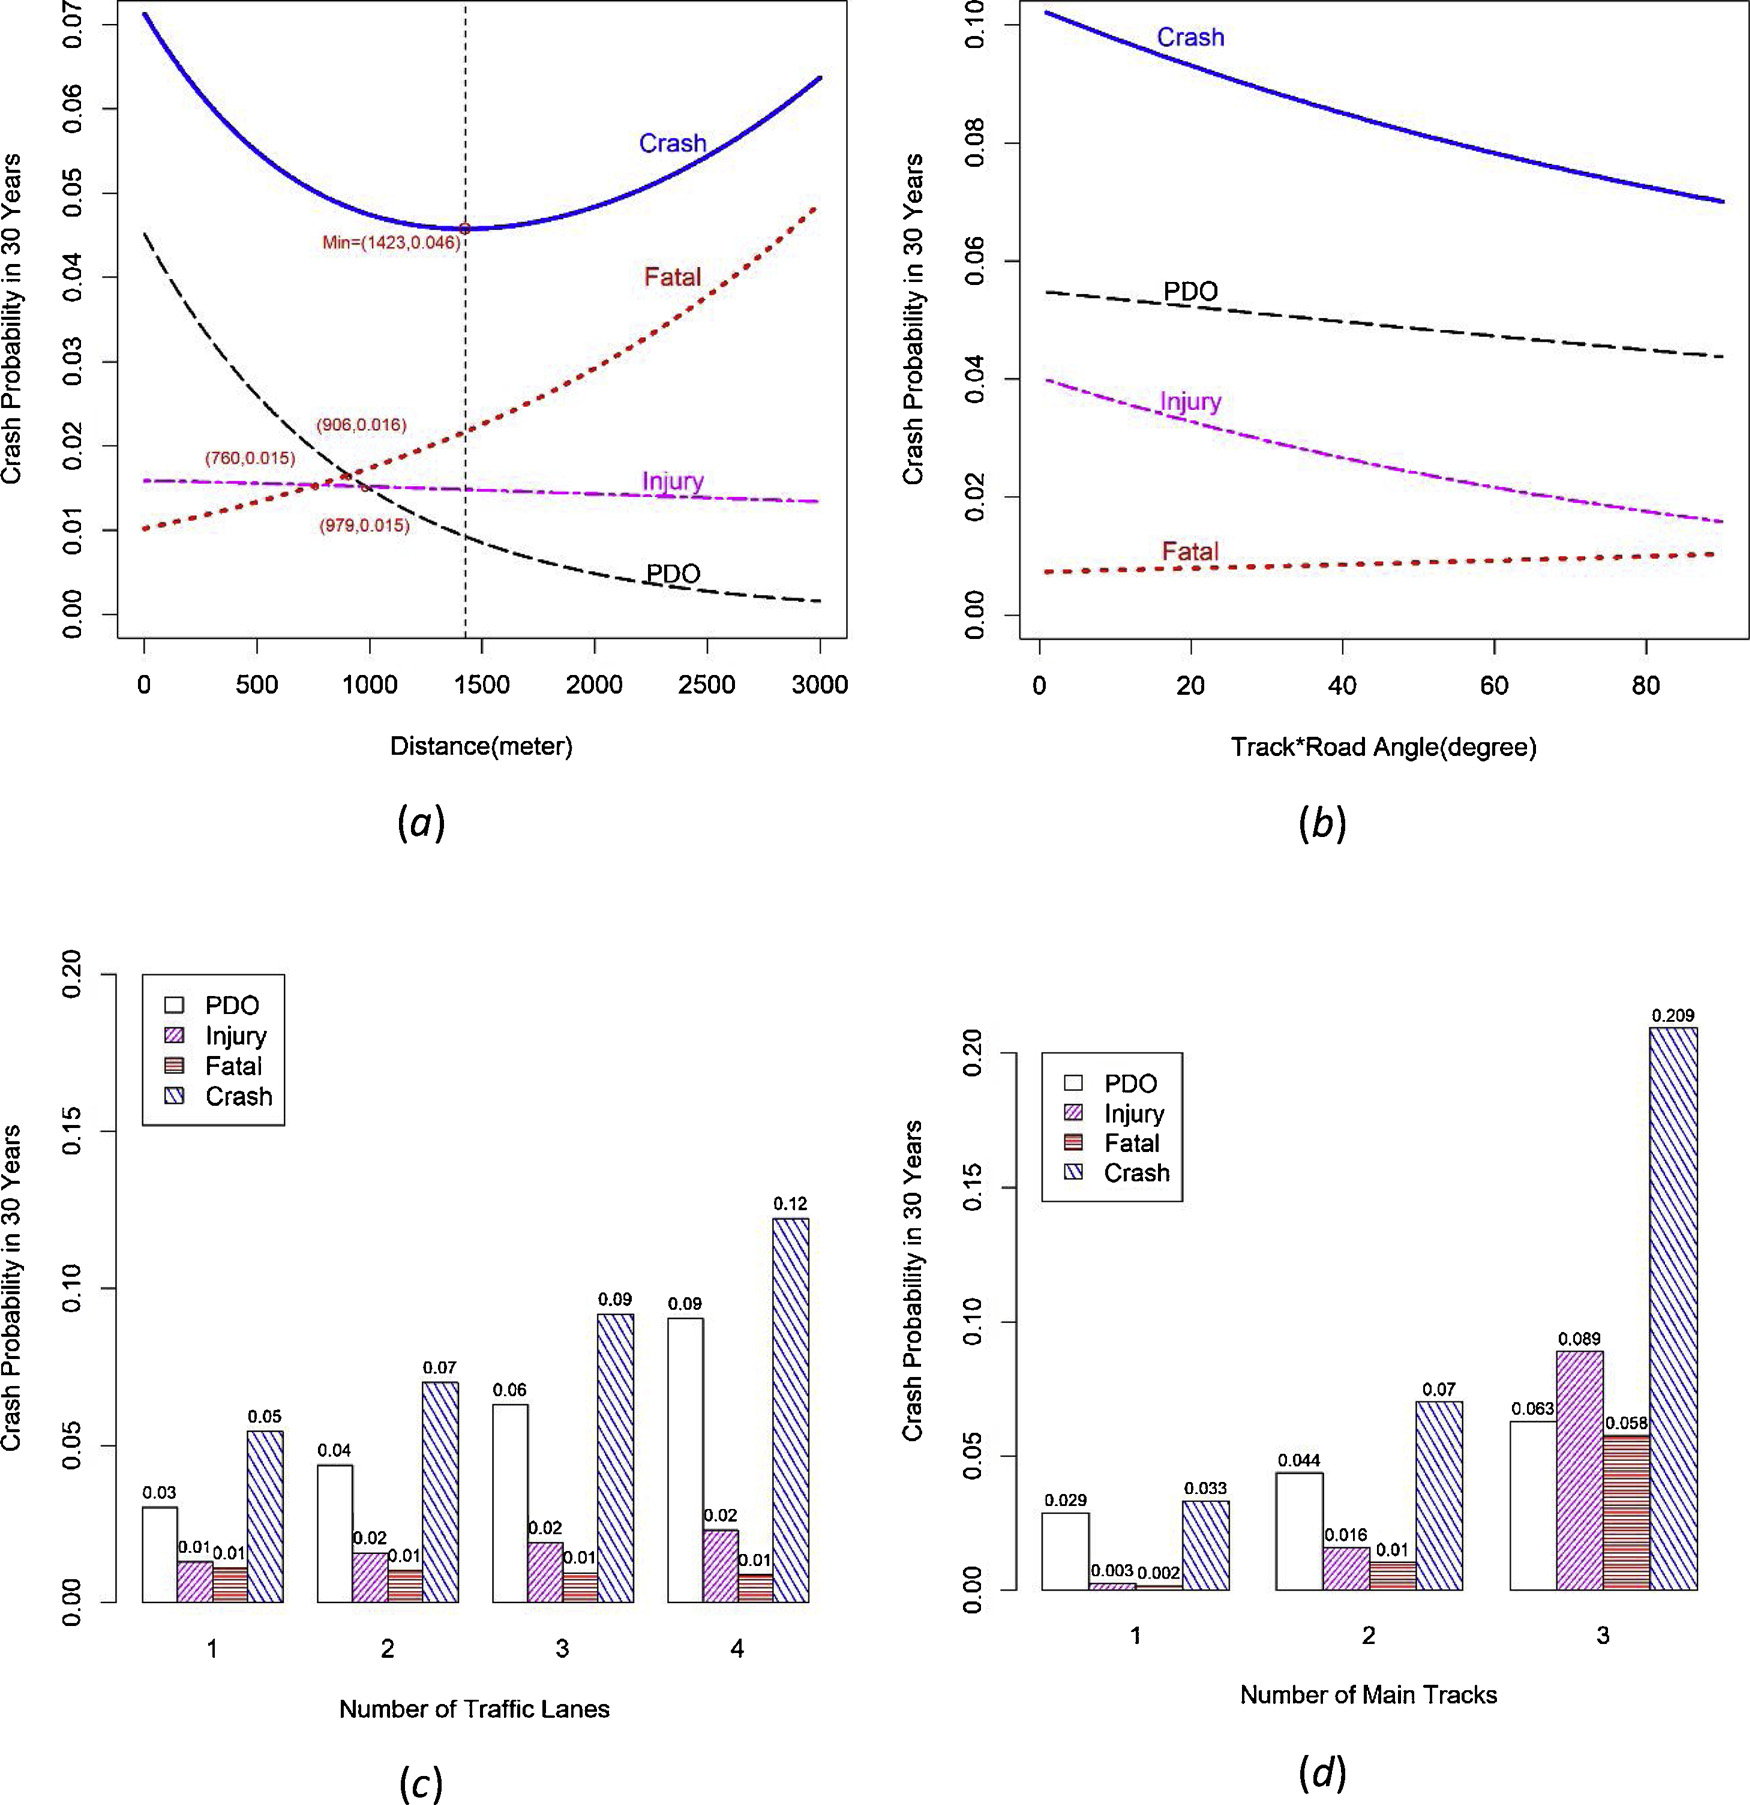
Increasing main tracks from one to three raised modeled 30-year crash probability from 3.3% to 20.9% and fatal probability from 0.2% to 5.8%.
Increasing roadway lanes from one to four raised modeled 30-year crash probability from approximately 5% to 12%; one additional lane increased the crash-occurrence hazard by 34.51% and the property-damage hazard by 45.65%.
Distance to the nearest road intersection followed a nonlinear curve: modeled crash probability fell to about 4.6% near 1,423 meters, then rose toward 6% by 3,000 meters.
Larger acute crossing angles generally reduced overall, property-damage, and injury probabilities, while fatal probability increased slightly—evidence that geometry should be reviewed by severity, not through one aggregate score.
06 / AGENCY & INDUSTRY IMPACT
Designed to support a decision.
The analysis shows where added infrastructure complexity can amplify risk and gives safety teams continuous, site-level evidence for targeting countermeasures. It does not suggest removing lanes or tracks; it identifies the locations where protection deserves greater attention.
All four geometric factors were tested inside a multivariable survival framework with traffic, train-operation, surface, and detection controls. Statistical significance and 30-year probability curves were reviewed by outcome rather than collapsed into one score.
Supports network screening and site review by showing where multiple lanes, multiple tracks, unusual angles, or intersection spacing call for stronger controls, targeted diagnostics, or more detailed engineering analysis.