Separate frequency and severity models can use incompatible samples and overlook dependence among mutually exclusive outcomes. Rare fatal crashes also make ordinary multi-class classification unstable.
Completed projectAugust 2020Statistical ML · Rare-event safety
Simultaneous crash-frequency and severity modeling
Designed a single competing-risk framework that estimates whether a crash occurs and which severity follows, using all crossing records rather than discarding sites with no observed crash.
My roleProject Lead · Model Developer · First Author
3,310public crossings modeled
01 / PROBLEM & CONTEXT
A network-level safety model must learn from every crossing—including sites with no recorded crash—while keeping severity outcomes mutually exclusive and time dependent.
- Survival analysis
- Cox regression
- Risk ranking
02 / ENGINEERING PIPELINE
How the system moved from raw evidence to a usable decision.
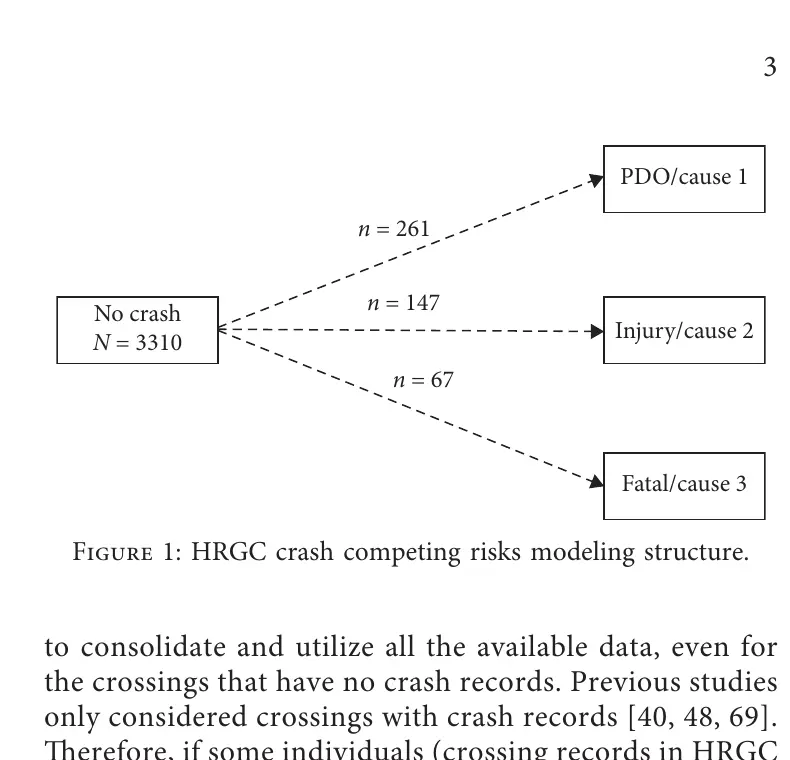
Formulated crash occurrence and three severity levels as competing failure causes within a Cox time-to-event structure, retaining 3,310 crossing records over a 29-year observation window.
Evidence
Data
Twenty-nine years of observation for 3,310 public crossings, with property-damage, injury, fatal, and censored no-crash records.
Pipeline
Data engineering
Built a unified survival table with time-to-first-event, cause-specific event codes, infrastructure and exposure attributes, and censoring for the majority no-crash population.
Signals
Data mining
Estimated how contributor relationships and cumulative risk differed across the three severity causes rather than pooling them into a single event label.
Model
ML / analytical method
A Cox competing-risk formulation was selected to estimate crash occurrence and severity simultaneously while retaining interpretable coefficients and censored histories.
Decision
System function
The model produces time-dependent probabilities for each severity and contributor effects that can drive screening, scenario comparison, and hazard ranking.
Proof
Validation
A single consistent population and event structure was used across all severity causes, eliminating the incompatible-sample problem created by separate frequency and severity models.
Plain-language glossary
Technical terms, made clear.
Retaining a crossing that had no observed crash for the period it was safely observed, instead of dropping it.
The probability that a specific first outcome occurs by a future time while accounting for the alternatives.
03 / KEY INNOVATIONS
What changed in the engineering approach.
Uses censored no-crash records instead of dropping the majority of the network.
One coefficient framework supports contributor analysis across all severity causes.
Cumulative incidence functions yield time-dependent, severity-specific probabilities for ranking and scenario comparison.
04 / TECHNICAL ARTIFACT
05 / MEASURABLE OUTCOMES
What the system established.
Estimated property-damage, injury, and fatal crash likelihoods simultaneously.
Preserved information from crossings with no crash history through censoring.
Produced interpretable contributor effects suitable for engineering review and hazard ranking.
06 / AGENCY & INDUSTRY IMPACT
Designed to support a decision.
Established the analytical foundation later used for statewide prioritization, countermeasure evaluation, and agency decision-support tools.
A single consistent population and event structure was used across all severity causes, eliminating the incompatible-sample problem created by separate frequency and severity models.
Provides the statistical foundation for network screening, contributor diagnosis, and severity-aware countermeasure analysis.