Crossing data01
Assemble longitudinal safety records
North Dakota crossing inventory, crash, control-device, traffic, train-service, and geometric information form a common time-to-event dataset.
HIGHWAY-RAIL GRADE-CROSSING DECISION SUPPORT
An interactive safety application that turns a competing-risk survival model into a practical comparison of crossing controls, geometry, crash occurrence, and severity over time.
01 / PRODUCT OVERVIEW
Crossing-prioritization methods often compress risk into a single score or study crash frequency and severity separately. That can hide important tradeoffs.
This application exposes the fitted survival relationships directly. A user can change the warning-device combination and crossing geometry, then inspect how predicted crash occurrence and severity evolve—not only whether one scenario receives a higher or lower rank.
02 / USER WORKFLOW
The interface keeps assumptions visible and connects every input to multiple complementary outputs.
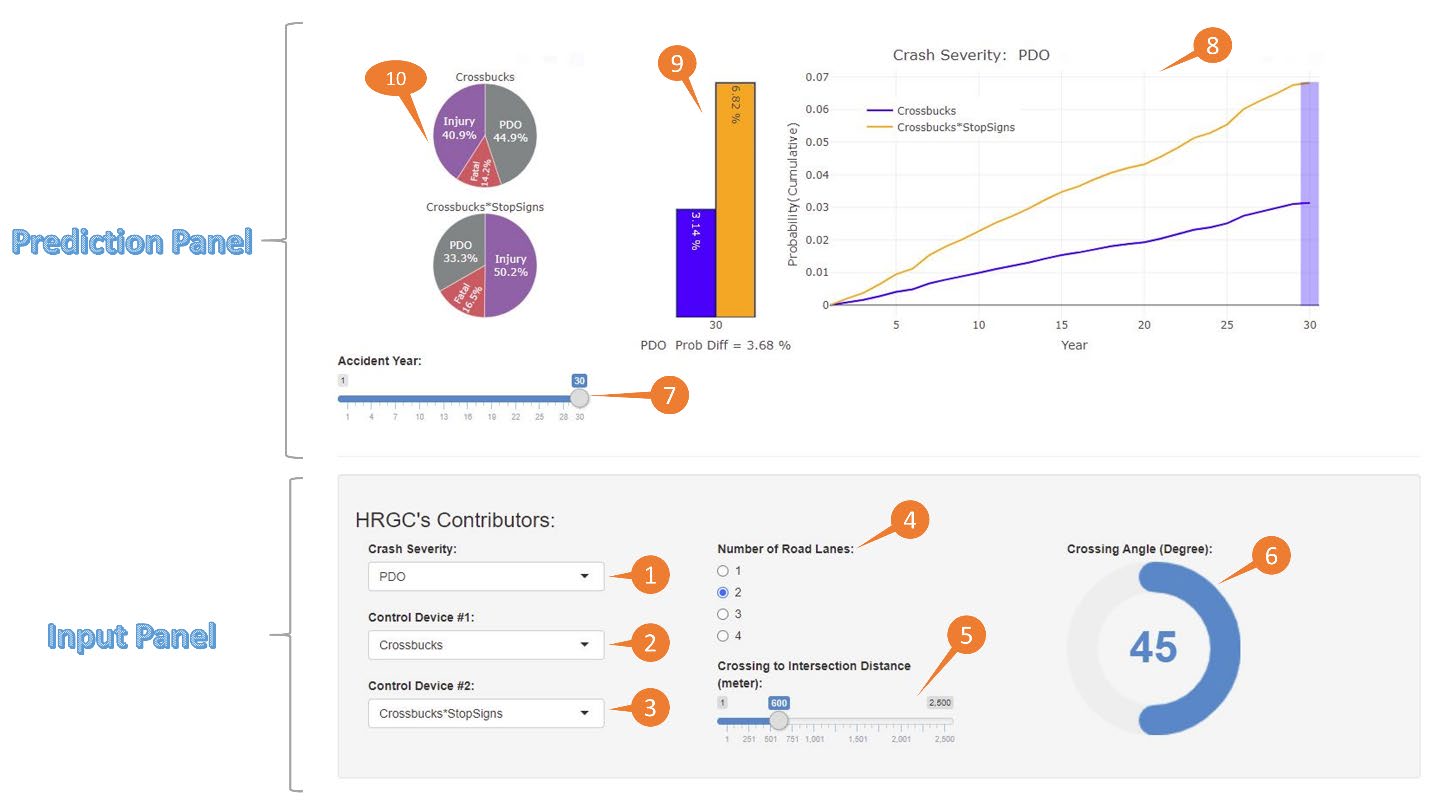
Choose total crash occurrence or a severity-specific outcome: property-damage-only, injury, or fatal crash likelihood.
Select a reference and an alternative from 28 control-device configurations for a direct safety comparison.
Adjust roadway lanes, crossing-to-intersection distance, and the acute highway-rail crossing angle.
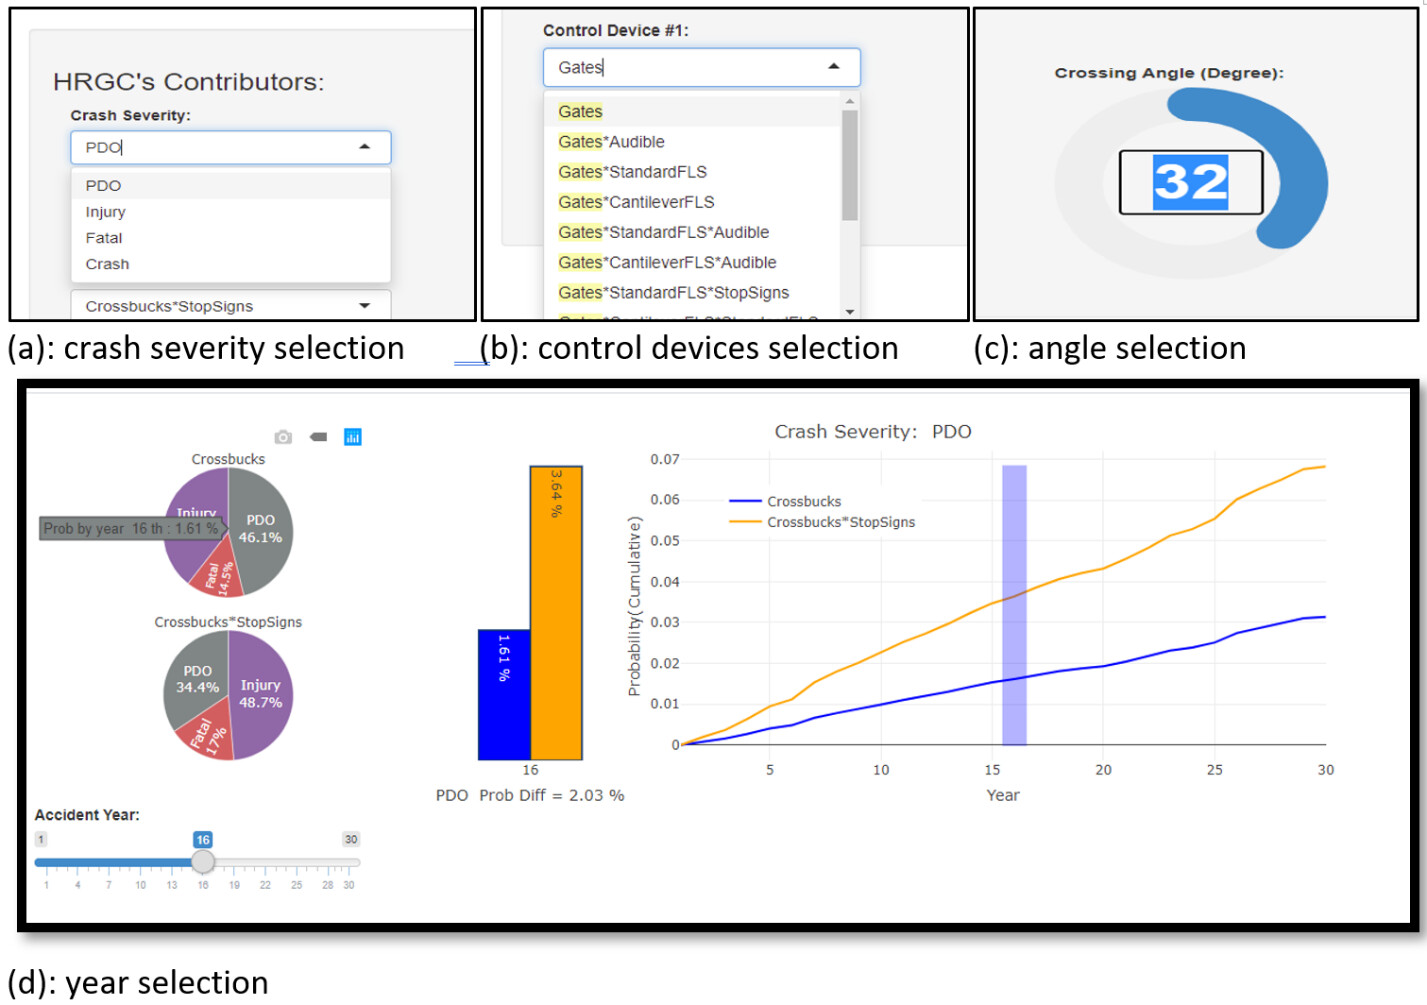
Move the year control across the 29-year model horizon to inspect short- and long-term differences.
Read cumulative-probability curves, a year-specific bar comparison, and severity-share pie charts together.
03 / MODEL-TO-APPLICATION PIPELINE
Competing risks means that property-damage-only, injury, and fatal outcomes are treated as mutually exclusive event types whose relationships should not be analyzed in isolation.
North Dakota crossing inventory, crash, control-device, traffic, train-service, and geometric information form a common time-to-event dataset.
A competing-risk framework with Cox proportional-hazard regression models crash occurrence and severity using a shared set of predictors.
The application applies fitted relationships to user-selected device and geometry combinations across the forecast horizon.
Linked curves, bars, and severity shares reveal when a countermeasure produces different effects across outcomes or time.
04 / APPLICATION INTERFACE
Figures reproduced from the U.S. DOT report show the linked input and prediction panels and the year-specific scenario controls.
05 / VERIFIED MODEL EVIDENCE
The report’s example compares crossbucks-only with crossbucks plus stop signs and shows a 2.03-percentage-point modeled difference.
Across the studied conditions, increasing roadway lanes from one to four raised the reported cumulative crash likelihood.
Increasing main tracks from one to three produced a substantial modeled increase, illustrating why geometry cannot be reduced to a generic crossing label.
06 / DECISION VALUE & LIMITS
The report demonstrates that adding a traffic-control device does not automatically improve every safety outcome. Effectiveness depends on the existing control configuration, crossing geometry, time horizon, and the outcome being evaluated.
The model was estimated from North Dakota data. The authors recommend before-and-after evaluation, interaction-effect analysis, and life-cycle cost analysis before a treatment is selected for a real crossing.
Read the complete methodology and limitationsTRY THE PRODUCT
Open the live R Shiny application or review the complete U.S. DOT research report.